Graphical value display

The graphical value display shows telegram values visually in order to make changes or statuses recognizable at a glance. It can be displayed in various forms, such as bar, ring or pie charts.
CONTROL L only!
This element is only available in the CONTROL L.
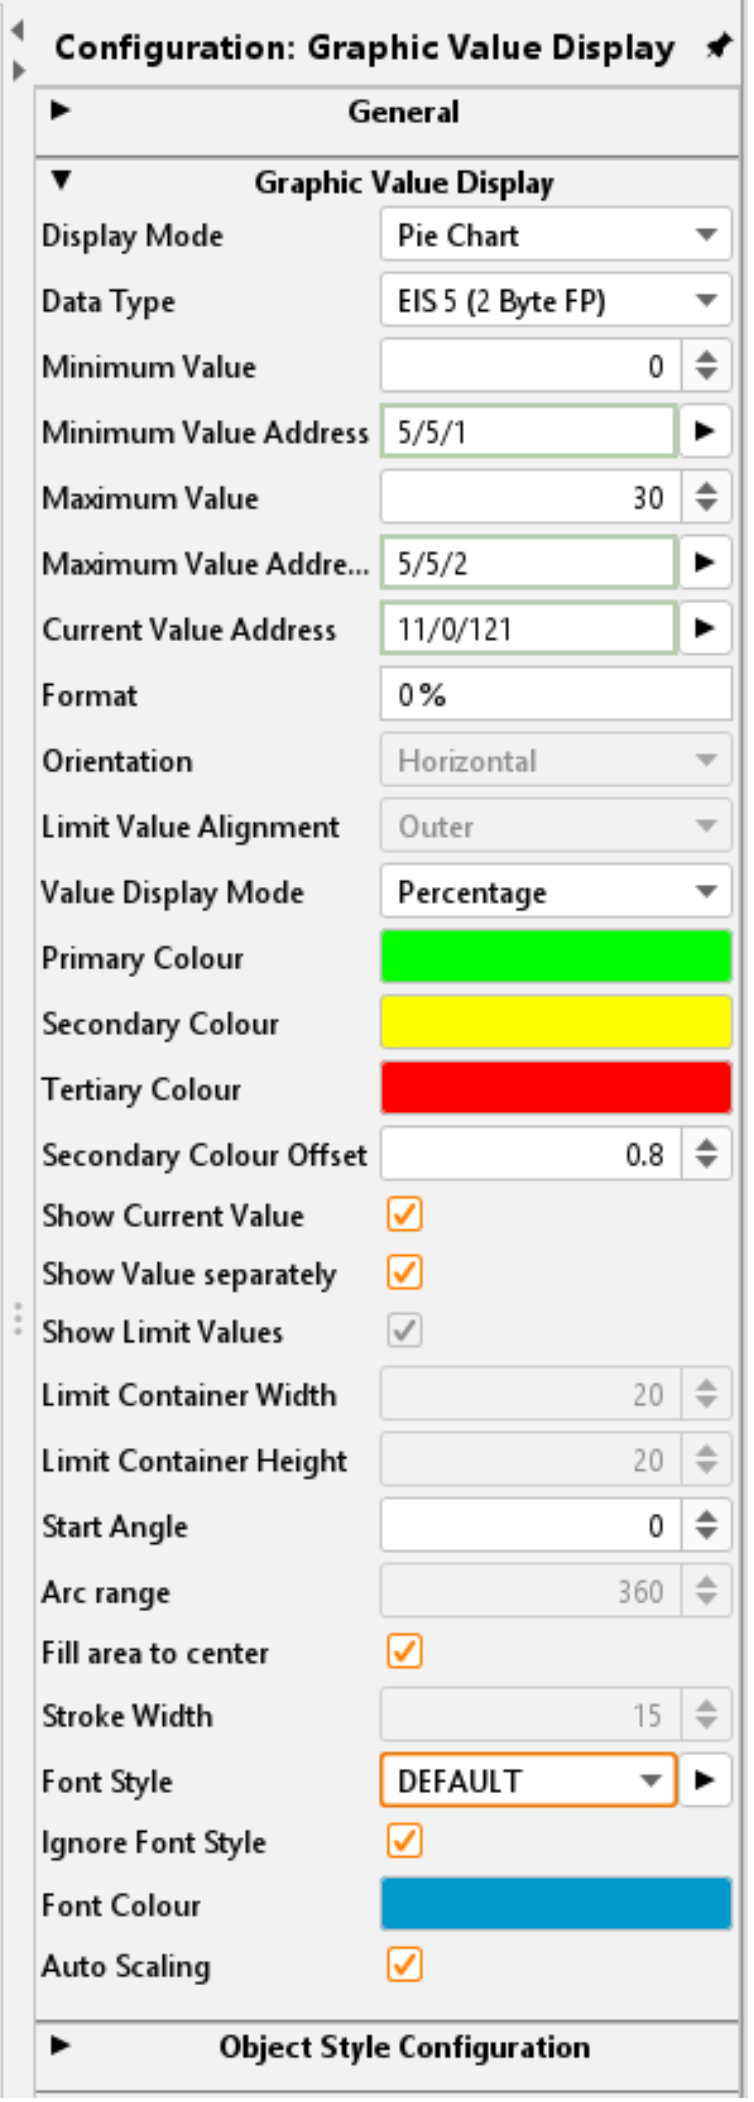
Specific parameters
Display Mode
The following diagram types can be selected:
Pie chart,
bar chart and
dynamic pie chart
Data type
Almost all existing data types in the KNX system (according to EIS) are available to the element. These are
EIS 5 (2 Byte FP), Fließkommazahl
EIS 6 (1 Byte), Prozentwert
EIS 9 (4 Byte FP), Fließkommazahl nach IEEE
EIS 10s (2 Byte, signed), mit Vorzeichen
EIS 10u (2 Byte, unsigned), ohne Vorzeichen
EIS 11s (4 Byte, signed), mit Vorzeichen
EIS 11u (4 Byte, unsigned), ohne Vorzeichen
EIS 14s (1 Byte, signed), mit Vorzeichen
EIS 14u (1 Byte, unsigned), ohne Vorzeichen
Minimum value / address: Minimum value
The minimum value for the graphical value display defines the lower (value) limit and thus the start of the scale.
This value can either be defined once in the editor or changed dynamically via a KNX group address.
If the current value is smaller than the start value, it is not displayed.
Maximum value / address: Maximum value
Specification of the upper (value) limit for the graphical value display. This value can also be fixed in the editor or changed at runtime via a KNX group address.
Current values above the maximum value are no longer displayed.
Note on the scale and increment of the scale:
The maximum value influences the step width of the scale. The current value is always displayed as a percentage of the entire scale, with 100% corresponding to the difference between the minimum and maximum value. Example:
Current Value: 25
Minimum Value: 0
Maximum Value: 50
→ The scale shows 50 %, as 25 is exactly half of the range from 0 to 50.
Address: Current value
The values that are received via the entered KNX group address are displayed in the graphical element.
Format
This field can be used to format the received value as required. A unit can also be added to the value here. The following applies:
# = one optional position
0 = a 'mandatory' position
If a “0” is set, this position is displayed in any case, regardless of whether the input value would occupy this position or not. If the “#” is used, the digit is only displayed if it is occupied by the input value.
Example: Telegram value is 23.4 (degrees). The desired display should always have two decimal places and the corresponding unit. The format: ##.00 °C formats the telegram value as 23.40 °C.
Graphical value display - Parameters
Orientation
This option can be used to align the bar chart either horizontally or vertically. This setting is only available for the bar chart.
Show Limit values
This option determines whether the limit values are placed inside or outside the bar chart.
This option is only available if the bar chart is used and the “Show limit values” option is activated.
Value display mode
This option makes it possible to display the current value either as an absolute numerical value or as a percentage value.
Absolute: The exact value is displayed.
Percentage: The value is calculated in relation to the set minimum and maximum value and displayed as a percentage.
This setting helps to adapt the display to individual requirements.
Primary colour / secondary colour / tertiary colour
These options enable the colour design of the graphic value display/diagram.
Primary colour: In the scale, this colour is assigned to the beginning of the value range.
In the dynamic pie chart, the primary colour marks the range of the current value.Secondary colour: This colour is used for the middle area of the value range.
In the dynamic pie chart, the unused area is filled with the secondary colour.Tertiary colour: The colour set here is assigned at the end of the scale.
Note: This colour is not available for the dynamic pie chart.
Secondary Colour Offset
This value specifies the proportion of the secondary colour. As the offset value increases, the proportion of the tertiary colour decreases.
The offset value can be set in 0.05 steps from 0 to 1.
Show current value
This option determines whether the current value should also be shown in the graphical value display. If activated, the value is displayed (as text) in the centre of the element.
Show value separately
If the ‘Show current value’ option is activated, the value can be placed below the diagram instead of in the centre of the graphical value display. This improves the legibility of the current value if necessary.
This option is not available for bar charts.
Activating this setting increases the height of the visualisation element.
Show Limit Values
This option displays the set limit values. They are displayed above/below or to the left/right of the bar chart, depending on its orientation.
This setting is only available for the bar chart.
Limit Container Width/Height
The height and width of this value refers to the distance of the limit value from the chart. Depending on the orientation of the bar chart, the corresponding input field is activated.
This option is only available for the bar chart.
Start Angle
This option defines the angle at which the pie chart starts. The value is specified in degrees and determines the starting position of the graphical display. 0° is at the top at 12 o'clock.
Arc range
Determines how large the displayed section of the pie chart is. A value of 360° shows a complete circle, while smaller values only show a partial arc. This value is also specified in degrees.
This option is only available for the dynamic pie chart.
Fill area to center
This option determines whether the area of the pie chart is drawn up to the centre point.
Activated:
The value is displayed as a classic ‘pie chart’ in which the area is drawn to the centre point.Deactivated: The dynamic pie chart then appears as a ‘ring chart’ (donut chart) in which the area does not extend to the centre point.
This option is only available for the dynamic pie chart.
Stroke Width
This option is only available if the ‘Area to centre point’ option is deactivated.
The value is specified in pixels and determines the width of the ring in the dynamic pie chart/ring diagram.
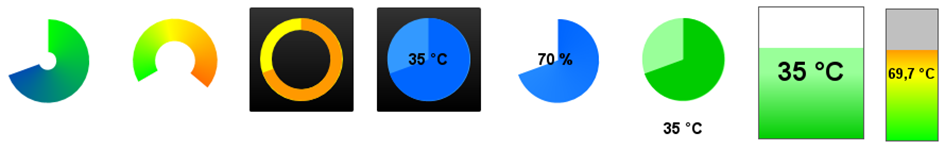
Various examples: