Energy Flow

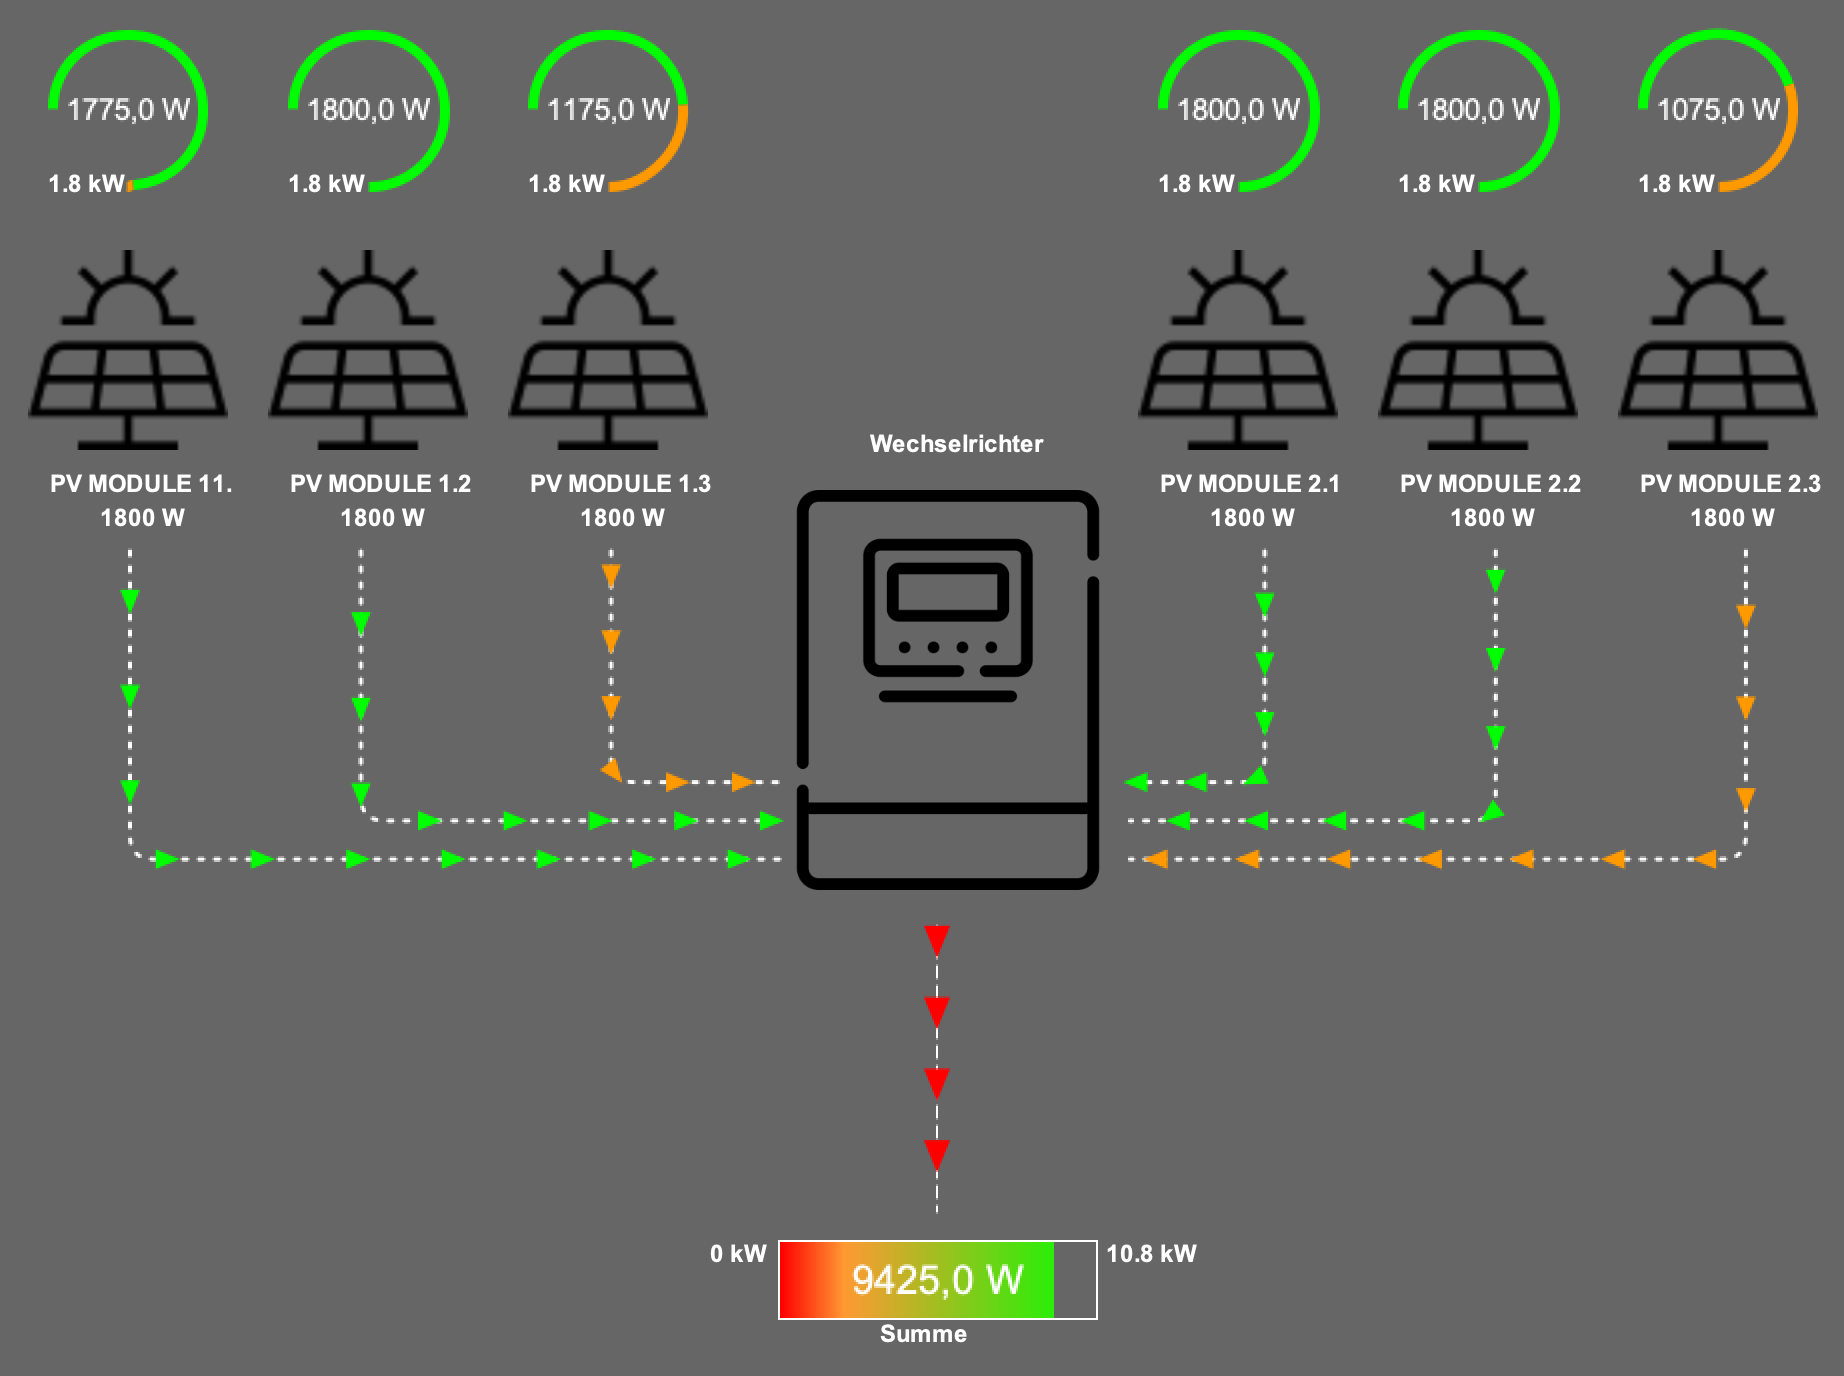
The energy flow visualization element is designed to make energy consumption and supply comprehensible not only numerically but also visually.
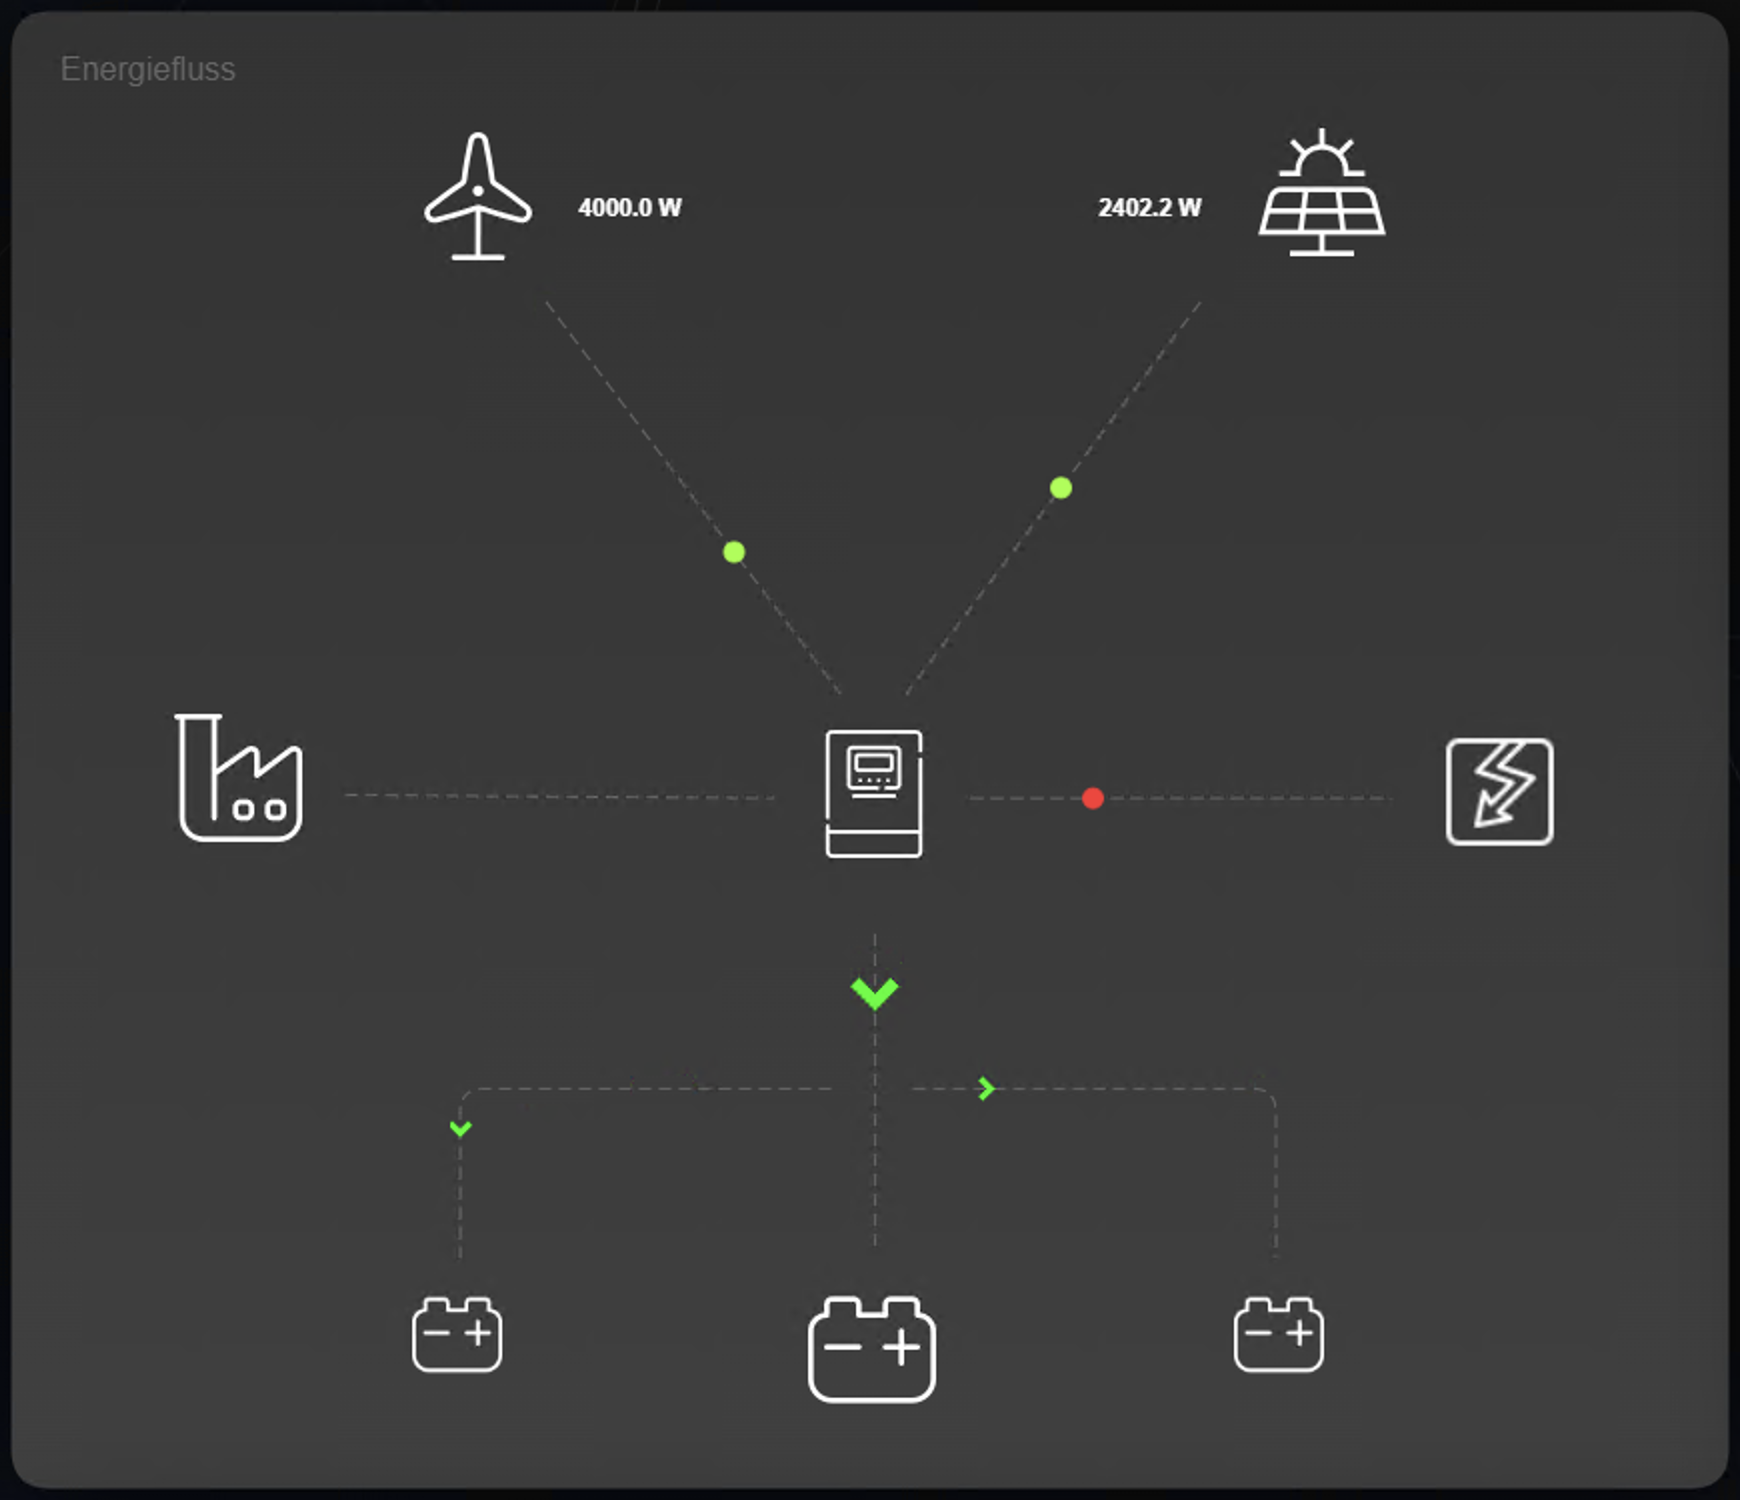
Instead of mere numbers, you see animated markers along defined paths, whose direction reflects the flow direction and whose behavior reflects the current intensity. This is particularly helpful when multiple energy sources and consumers are consolidated on one side and the system’s dynamics need to remain easily understandable.
The energy flow visualization element is not predefined and can be customized as desired.
You can add multiple paths to an energy flow element and draw them in any way you like.
The object generally operates in two modes.
In Total mode, a single group address is used. This provides a signed balance value, typically calculated as consumption minus supply. Positive and negative values can then trigger different directions or colors.
In Difference mode, consumption and supply are tracked separately. Two addresses are used for this: one for consumption and one for supply. This mode is suitable when the data source provides both directions separately and without signs.
CONTROL L Support
This element can also be used for CONTROL L.
Specific parameters
Energy Flow - Pfad configuration
The actual geometry is created in the path configuration. There, you can define multiple paths for each energy flow visualization element to represent different flow paths. Each path is created and configured independently under its own tab.
You can set, move, and delete the points along the paths, allowing you to shape the line routing directly in the preview area.
The grid size supports clean, reproducible placement of points. Important: The grid setting is path-specific. This means that each path can use its own grid size. If you change the grid size of a path, the points on that path are transferred to the nearest grid. This keeps lines consistent, even if you later want to work with finer or coarser settings.
The object also allows closed paths. At the same time, it prevents segments from being used twice, ensuring that the path remains geometrically clean.
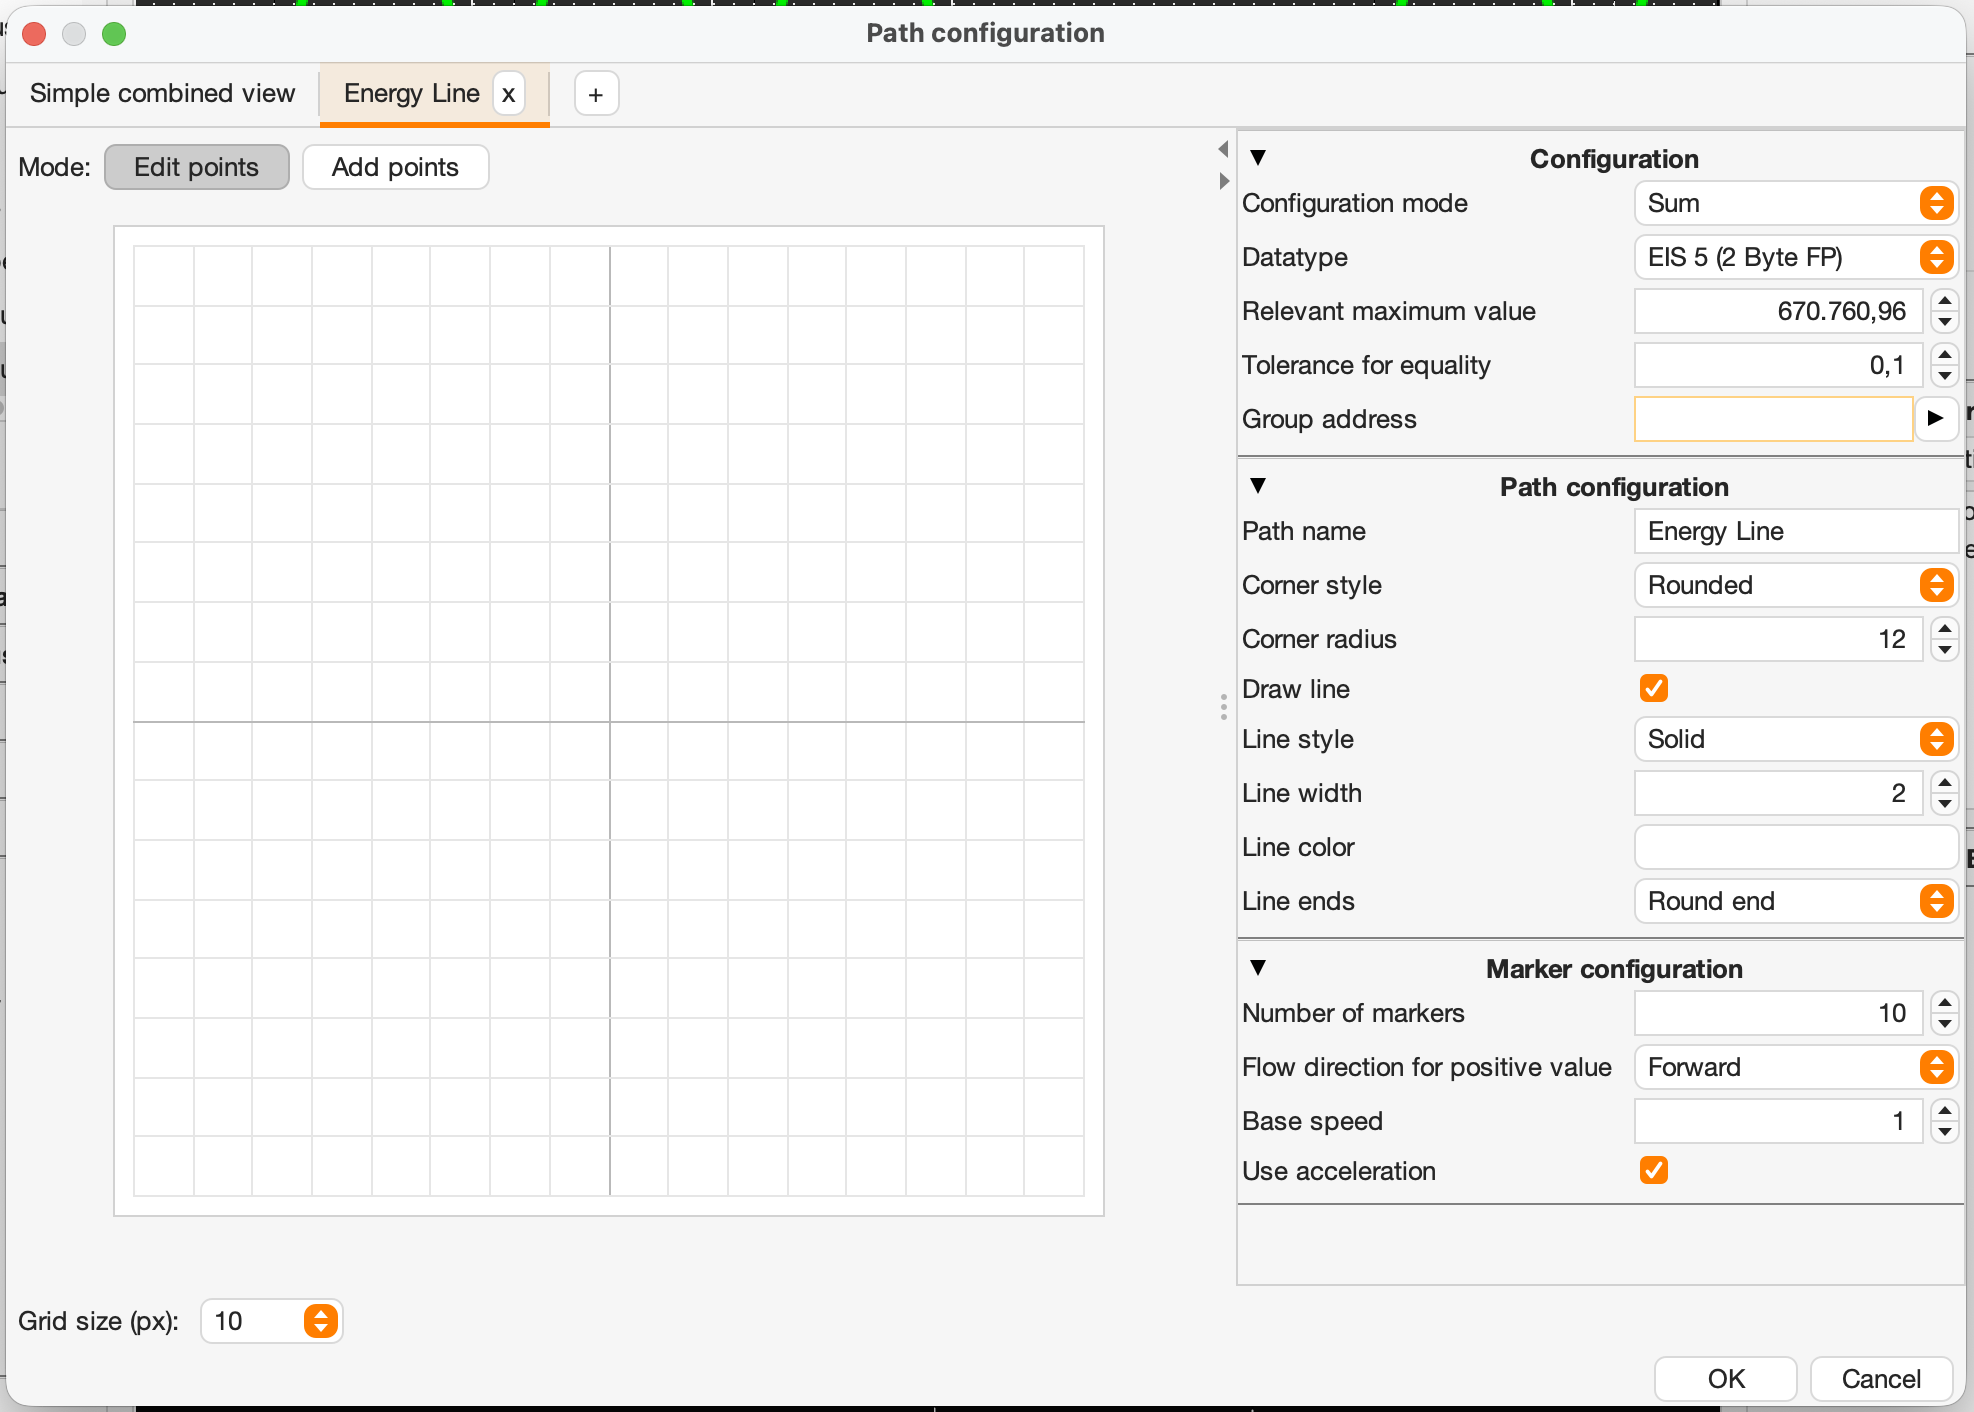
Path configuration
General
“Simple Overview”
This tab displays all existing paths together in a single view.
Paths
Here, all paths can be accessed and configured under their respective tabs.
“+” Button
This button is used to add a new path.
Edit Mode: “Edit Points” and “Add Points”
These two buttons allow you to select the desired edit mode.
Edit Points. Existing points can be moved by holding down the left mouse button.
Points can be deleted with a right-click.Add Points. In this mode, new points can be set. If no point exists yet, the starting point is placed with a mouse click.
If points already exist, an additional point can be added—starting from the last point set.
Configuration
Configuration Mode
Here you can adjust the configuration mode.
Sum: Here, a group address determines the total energy balance (signed values).
The expected result is the difference between consumption and supply.Difference: Here, the primary address determines consumption, and the secondary address determines supply (values without signs).
Data Type
Here you can select the data types depending on the configuration mode
Total: Data types with signs
Difference: Data types without signs
Possible data point types:
DPT Type | EIS Type | Size | Data type |
|---|---|---|---|
9.xxx | EIS 5 | 2 Byte | Float (16 Bit) |
14.xxx | EIS 9 | 4 Byte | Float (32 Bit) |
8.xxx | EIS 10s | 2 Byte | Integer (signed) |
13.xxx | EIS 11s | 4 Byte | Integer (signed) |
6.xxx | EIS 14s | 1 Byte | Integer (signed) |
Relevant Maximum Value
Limit the value range to the maximum value relevant to you. Depending on the configuration, this affects the speed or color of the markers.
Tolerance for Equality
Often, two values are not exactly equal, or precision errors occur with floating-point numbers. Here you can set the absolute value up to which, in “Total” mode, or the difference up to which, in “Difference” mode, the result is still interpreted as 0, meaning the markers are not moved and are displayed in the standard color.
Group Address: Balance or Supply
Group address for the energy balance in “Total” configuration mode, or for the supply (i.e., your feed-in) in “Difference” mode.
Path Configuration
Path Name
Enter the name for the path here. This name will also be used for the tab.
Corner Style
Select the desired corner style here for the start and end of the path.
The options are: “Rounded” and “Square”.
Corner Radius
Use this option to specify how much the corners of a path are rounded. A higher value results in smoother, more rounded transitions, while a lower value makes the corners sharper.
Draw Line
Enables or disables the display of the path line for the markers.
Line Style
Select the desired line style here. The following options are available:
Solid
Dotted
Dashed
Dash-dot
Line Width
Specify the desired line width of the path here.
Line Color
Specify the desired line color for the path here.
Line End
Select the desired line end here. The following options are available:
Square End
Round End
Blunt End
Marker Configuration
Number of Markers
Enter the desired number of markers here. Possible values range from [0 - 25]
Flow Direction (for positive values)
Here you can set the flow direction. The following options are available:
Forward: In the direction of the arrow (from start to end)
Backward: Against the direction of the arrow (end to start)
Base Speed
Base speed of the markers. Possible values are [1 - 50]
Use Acceleration
When enabled, the marker speed is scaled relative to the maximum value.r
Three parameters are particularly relevant for movement: Base Speed, Use Acceleration, and Relevant Maximum Value. The maximum value is the reference point against which the current value is scaled. Depending on the configuration, it influences the marker’s movement and—when area colors are enabled—also the color assignment.
The equality tolerance helps to compensate for small fluctuations or rounding effects. Values within the tolerance band are treated as neutral, so that no unnecessary movement is simulated when the state is practically the same.
Marker
In addition to the geometry, you can use the marker configuration to control the shape, size, background color, and animation style. Depending on the settings, markers can fade in and out smoothly; this improves the visual appearance but may require more processing power for large visualizations.
The following settings apply to marker display in general:
Shape.
Select the shape of the markers that will be drawn along the path. Available marker shapes include:
Circle,
Square,
Diamond,
Arrow,
Triangle, and
Chevron.
Size.
The marker size can be freely adjusted in pixels (from 1 to 1,000).
Standard color.
This setting determines the color of the markers if the current value falls outside the configured threshold ranges.
Fade-In / Fade-Out
This optional feature smoothly fades markers in and out. The range within which the transparency changes can be adjusted individually.
Smoothly fading markers in and out may require higher system performance on the client side.
Enable Fade-In
Enables the smooth fade-in of markers at the start of the path.
Fade-In length
Relative fade-in range. The relative distance from the start of the path at which the fade-in is complete. Value specified as a percentage (from 0 to 100%)
Fade-Out
Enables the smooth fade-in of markers at the end of the path.
Fade-Out length
Relative fade-out range. The relative distance from the end of the path at which the fade-out is complete. Value specified as a percentage (from 0 to 100%)
The total of the fade-in and fade-out durations cannot exceed 100%.
Value ranges and colors
If you need more than one default color, you can control marker colors using relative value ranges. A rule consists of a direction (positive/negative), a comparison operator (> or <), a threshold value in percent, and a target color. The percentage value always refers to the relevant maximum value set in the path.
Additionally, presets are available to quickly apply typical red/green schemes. These presets are particularly useful for getting started or as a starting point for fine-tuning.
Preset
Initially, there are six different presets to choose from. The presets differ in the number of rules they contain. There is one preset each with one, three, and five rules, as well as the same rules in reverse order for the marker color.
Use “Marker Colors in Value Range” to define color rules:
Rules
Rules can be created “New” or “Removed.” Existing rules can be edited at any time by clicking “Edit.”
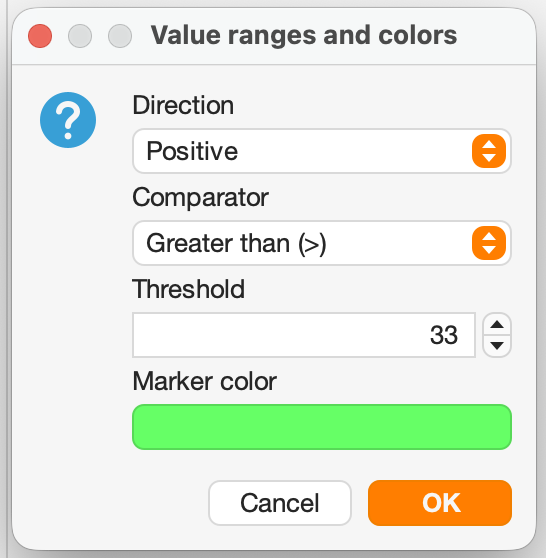
Configuration parameters for rules
Direction:
Select whether the range applies to positive values (typically purchase) or negative values (typically delivery).
Possible options: “positive” or “negative”.
Comperator:
Specifies whether the threshold value is checked to be greater than or less than.
Possible options: “Greater than (>)” or “Less than (<)”.
Threshold (%):
Threshold value in percent. Refers to the maximum value you set in the path configuration.
Permitted range: 0 to 100%.
Marker color:
Sets the color of the markers for the corresponding energy scenario Target marker color for this rule.
Select via the color selection dialog box.
The zone/preset color logic applies to the entire object (across all paths within the same object).
If you need different color rules for different paths with the same sign, use multiple Energy Flow objects instead of multiple paths within a single object.
Examples:
 | 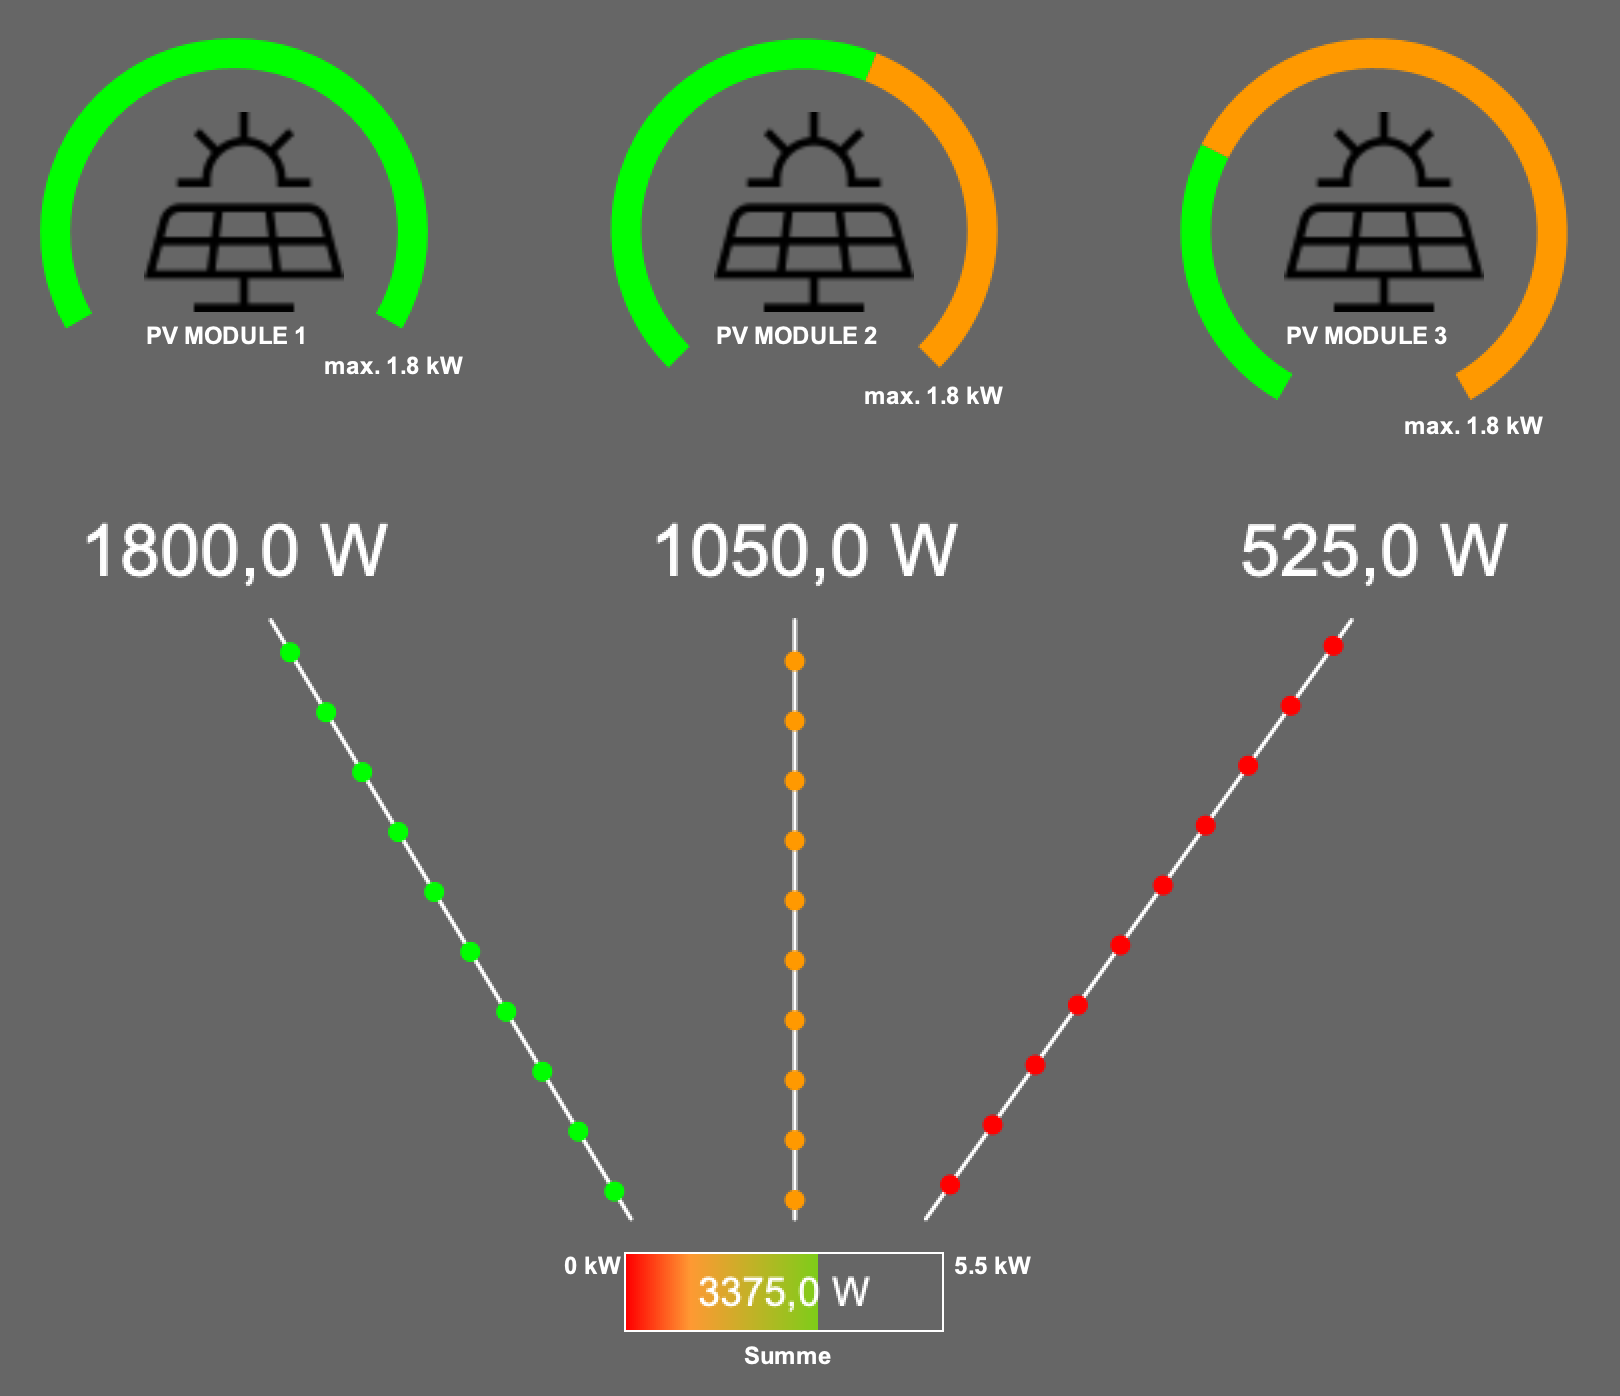 |  |
|---|