Behind the Values / Charts control element are a multitude of options for visualising, sending, comparing and graphically displaying values. A trend and ranking function for the values complete the range of functions. For configuration, only the group addresses of the values need to be specified.
The control element has a compact and a diagram view. The compact view is displayed in the ICP and ECP. Only values are displayed here (see figure on the right). In the EEV, there is also a large diagram and other functions. The extended view with the diagram is only generated by the editor if this has also been activated by option.
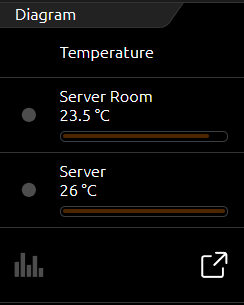
Compact view (ICP): The following options are available in this view (see figure right).
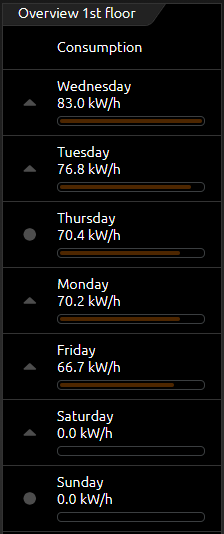
Trend function means that a symbol is displayed in front of each value, indicating in which "direction" the value is moving in the "ranking". A triangle with the tip pointing upwards means that the value has increased in the order (the value has risen). If the tip points downwards, the value has fallen in the order (the value has fallen). A circle means that this value has not changed in the sequence.
The Ranking function influences the sorting of the values in the list. If this function is active, the values are listed in descending order from top to bottom. The advantage of this is that the largest value always comes first and does not have to be searched for in the list of values. If the function is inactive, the values do not change their order and are displayed in the order in which they were created in the control element.
Bar display option. This option adds a bar display to each value. The bar of the highest value is fully filled, while the remaining bars are filled in percentage (to the highest value). This makes it possible to see with a quick glance how far the values differ from each other.
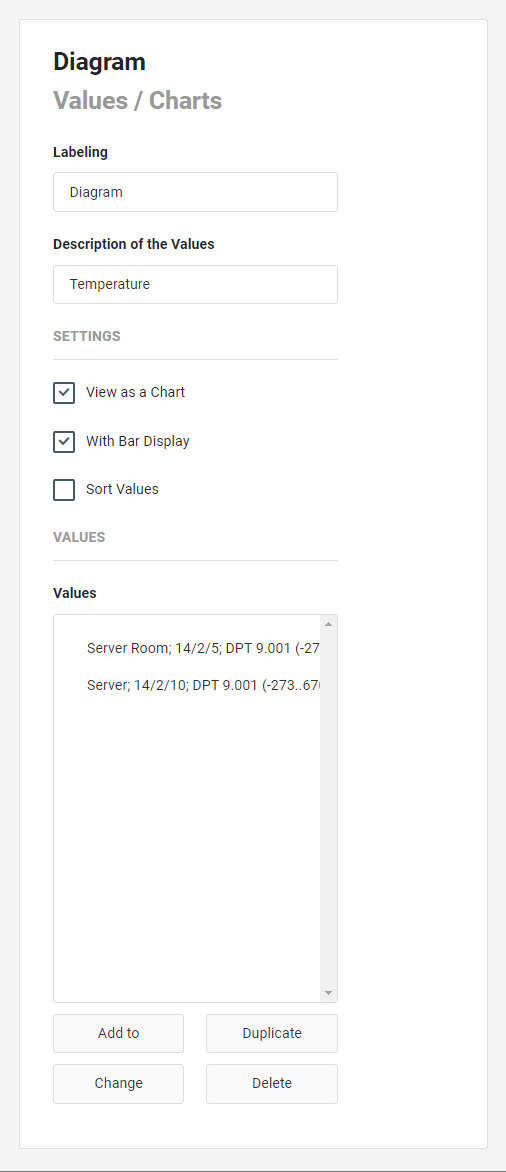
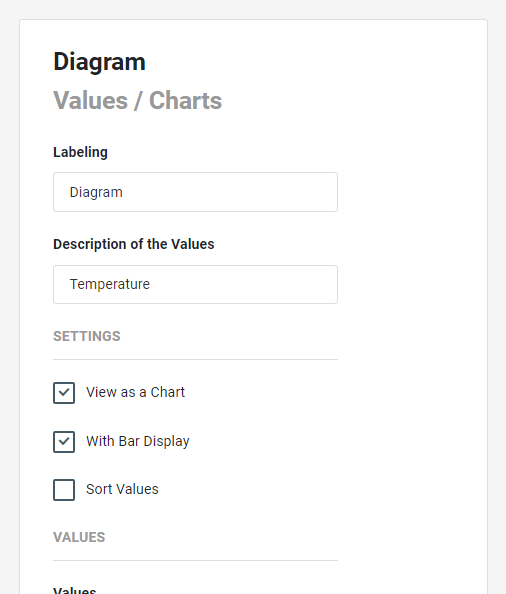
The Values / Charts control element has the following configuration fields (see figure on the left):
Labelling: The label is displayed in the title bar of the element.
Description of the Values: A description of the values can be entered here (for example: "Consumptions in watts", "Temperatures in °C"). These are displayed in the first line of the element.
SETTINGS
The following properties can be activated for the settings in the visualisation:
-
Display as diagram,
-
With bar display,
-
Sort values; with activation of this property, the trend for these values is displayed in the compact view and the value ranking is active.
VALUES
Values: Any number of values can be entered in the element.
With Add, Duplicate or Change a submenu opens for editing the values. Delete remove the entry.
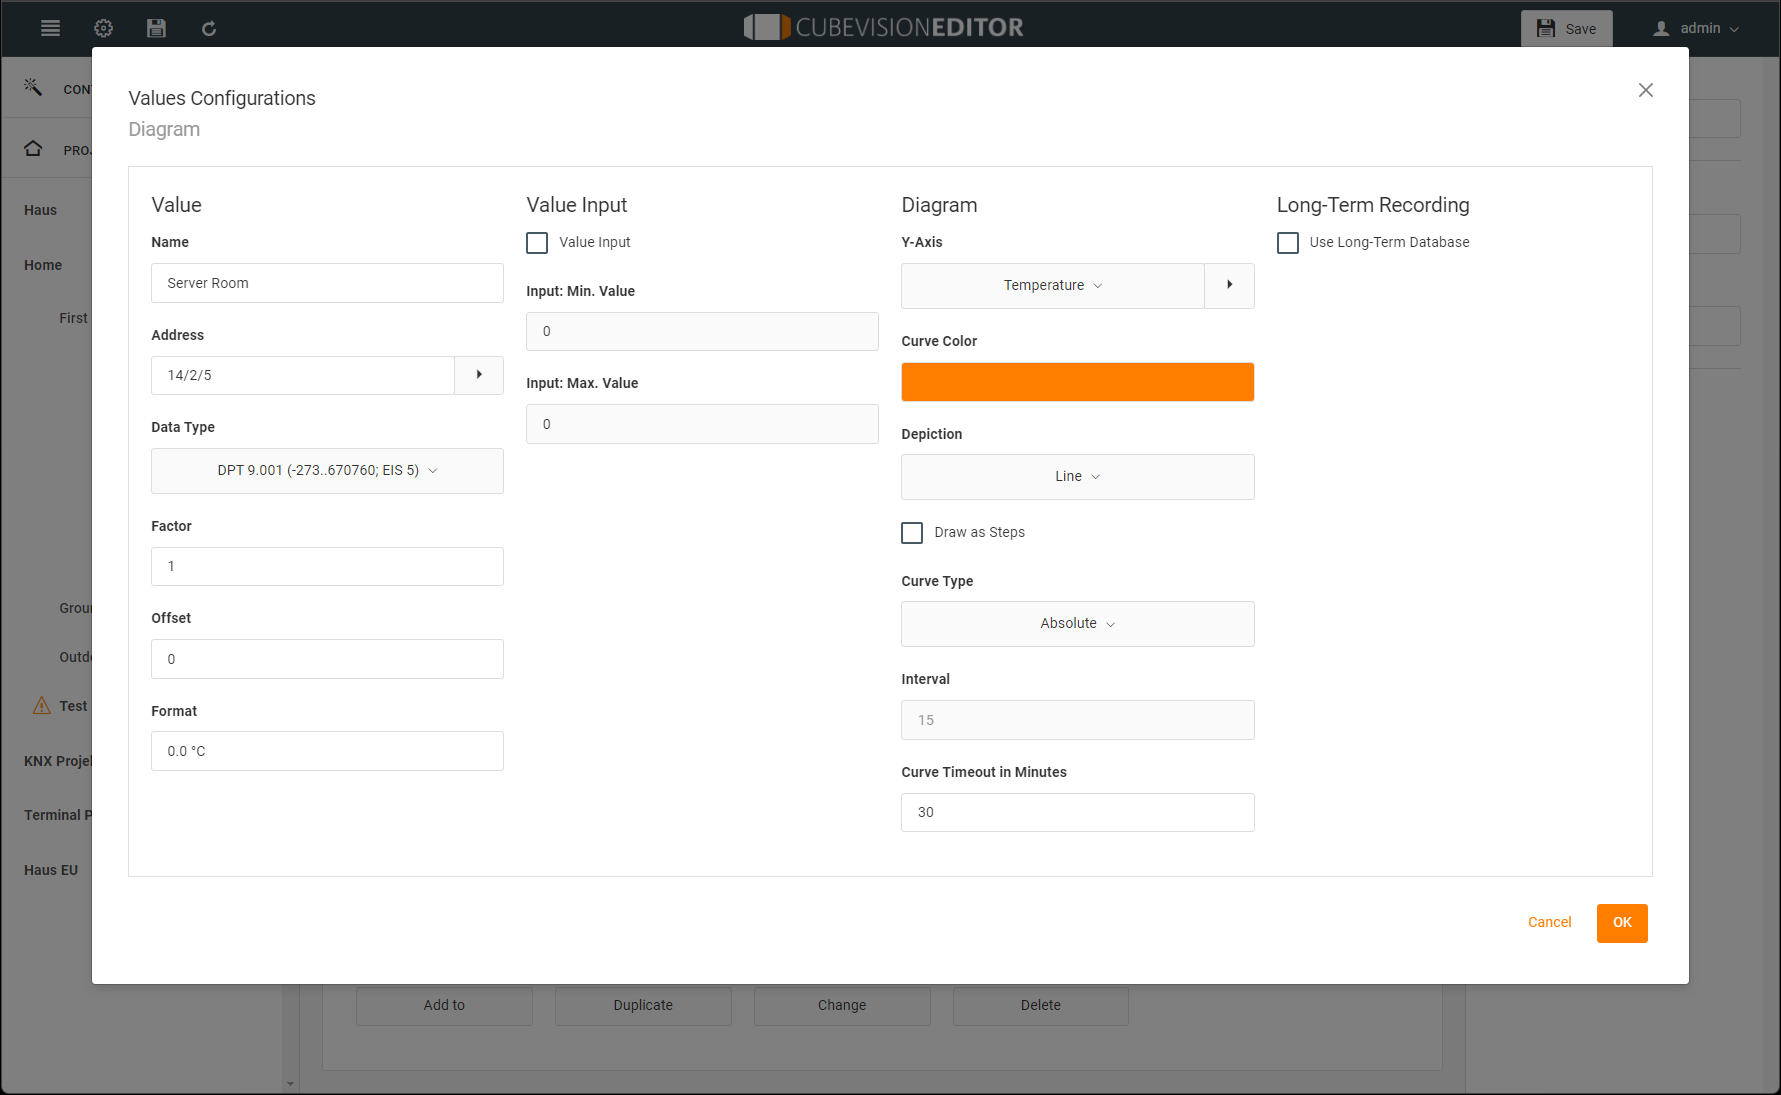
VALUE CONFIGURATION / DIAGRAM
Name: The name for this value (e.g. "Consumption refrigerator").
Address: The value is received via this address. Please note that this field cannot be edited if the long-term database is used for this data point.
Data Type: Select the data type for the value to be received here. Please note that this field is not editable if the long-term database is used for this data point. Selectable data types:
-
DPT 1.001 (on/off, EIS 1)
-
DPT 5.001 (0...100%; EIS 6)
-
DPT 5.010 (0...255; EIS 14u)
-
DPT 6.010 (-128...127; EIS 14s)
-
DPT 7.001 (0...65535; EIS 10u)
-
DPT 8.001 (-32768...32767; EIS 10s)
-
DPR 9.* (-670760...670760; EIS 5)
-
DPT 9.001 (-273...670760; EIS 5)
-
DPT 12.001 (4-byte signed; EIS 11s)
-
DPT 13.001 (4-byte unsigned; EIS 11u
-
DPT 14.* (4-byte floating point value; EIS 9)
-
DPT 29.* (8-byte signed)
Factor / Offset: The received value can be scaled with a factor and offset.
(Value = In value * Factor + Offset).
Format: The received value is formatted with according to the format configured here (e.g. 0.# °C) before being displayed.
VALUE Input
Value input: Activate this field if you want to enter values here in the visualisation.
Input: Min. Value: The minimum value that is accepted when entering a value. This defines a value range with a lower limit for the value entry.
Input: Max. Value: The maximum value that is accepted for a value entry. This defines a value range with an upper limit for the value input.
DIAGRAM
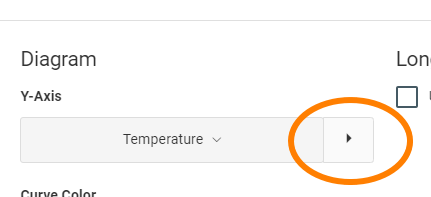
Y-Axis: The selection of the Y-axis. Additional Y-axes for other values can be created. Default values:
-
Value
-
Temperature
-
Percent
-
On/Off
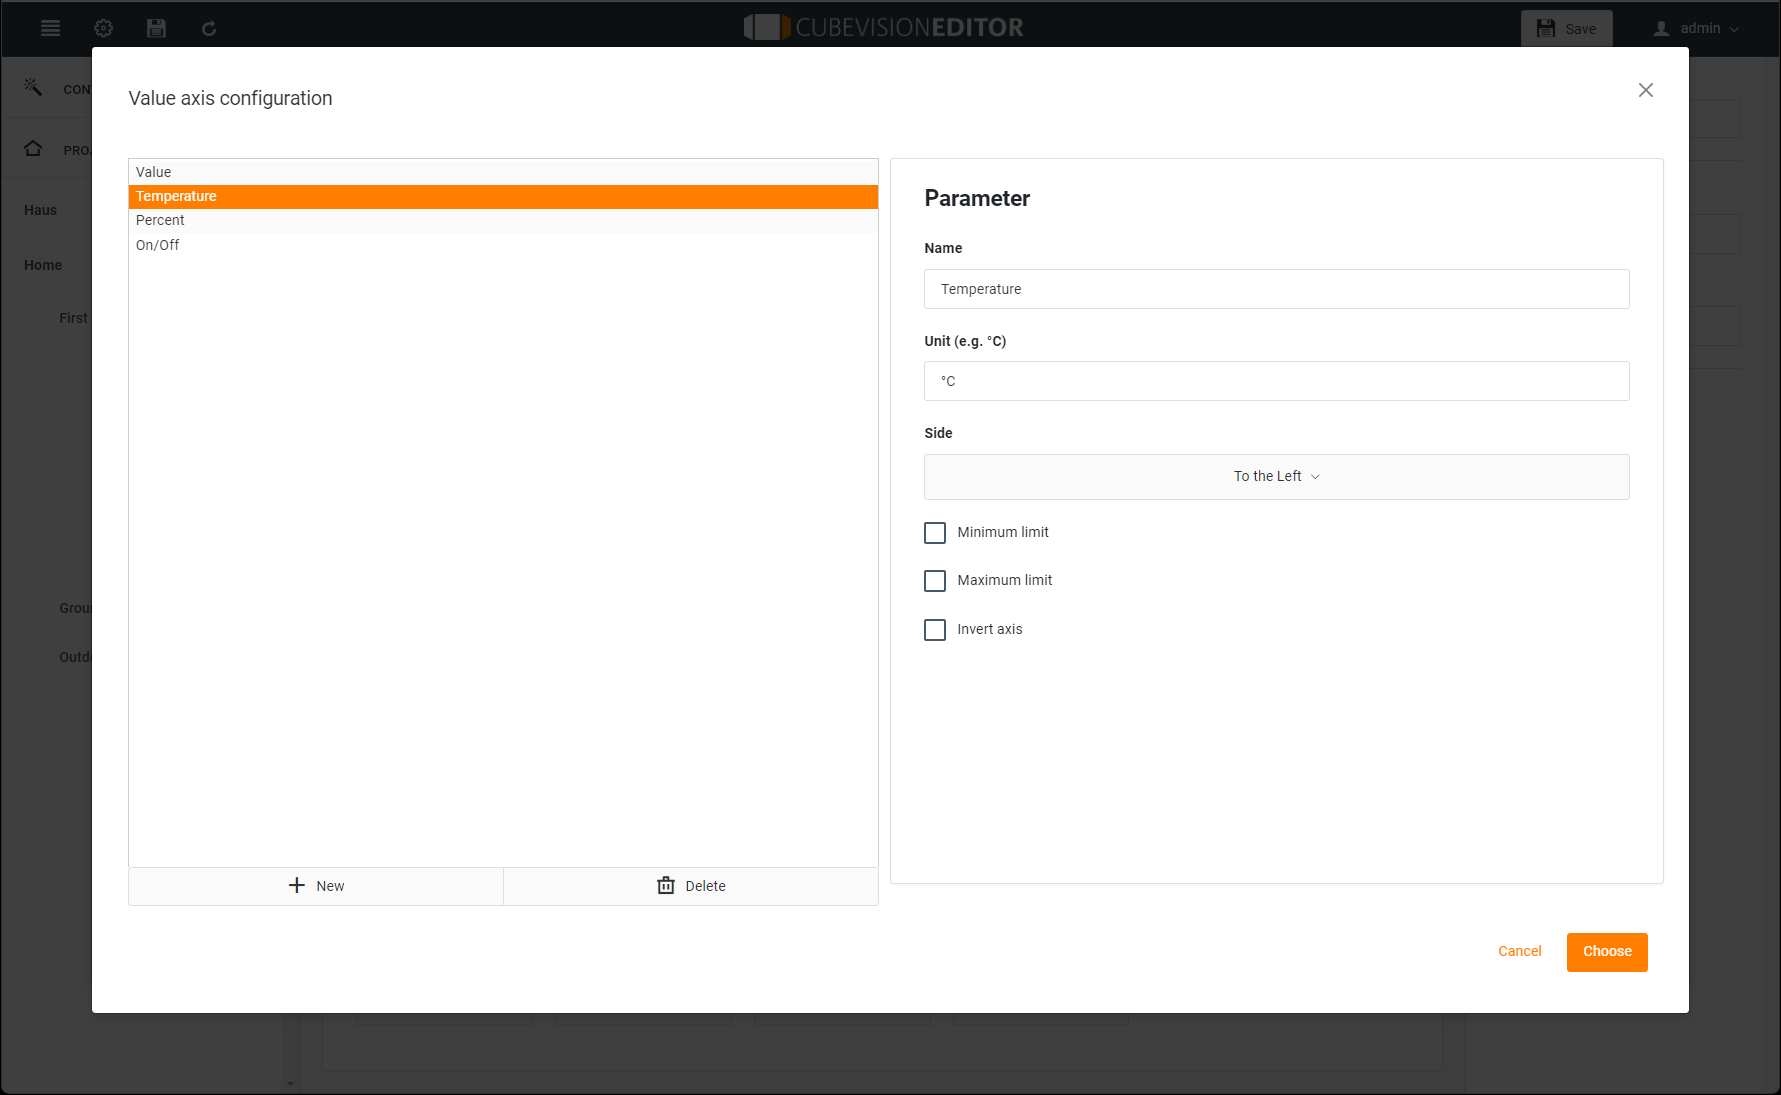
There is also another configuration window (Figure opposite) for creating and managing additional diagram axes. This can be used to create frequently used units, which are then listed in the pull-down menu and can be selected conveniently.
The following configuration options are available:
On the left half, the existing Y-axis configurations are listed. With the "+ New" button, the new configurations are added.
The parameters are set on the right side:
-
Name: This name is displayed vertically together with the Y-axis and in the tooltip.
-
Unit: The unit is displayed in brackets after the name of this unit.
-
Side: Defines whether the axis is placed to the left or right of the chart.
-
Minimum/Maximum Limit: This option activates the min. and max. limit for the Y-axis. This achieves a fixed scaling of the Y-axis.
If no limits are specified, the diagram control automatically scales the Y-axis. -
Invert axis: Select this function, if necessary, e.g. PV yield is indicated as feed-in value with "-", but the course of the graph should be positive.
Curve Color: This parameter defines the colour of the diagram curve.
Depiction: This parameter can be used to influence the display of the curve in the diagram.
-
Line: A simple line is drawn for the value.
-
Range: In addition to the line for the value, the range below the line is highlighted in colour.
-
Spline: A spline can "smooth" a curve with very strongly varying values.
-
Bar: The received values are displayed as bars. However, if values are sent in short time intervals, the bars are very narrow and are very close together.
Draw as steps: Activation prevents the linear connection of successive telegram values. Thus, for example, with EIS1 values you get a more meaningful representation as a rectangular curve.
Curve type: The curve type determines the way the data is prepared for the graph:
-
Absolute: The absolute value is displayed. Usually, temperatures or other current measured values.
-
Difference: The difference curve can be used, for example, for steadily increasing meter readings to create daily profiles.
Interval: If the option Difference is selected as the curve type, this parameter can be used to specify the interval time in minutes in which the difference to the respective last interval is calculated. The longer the interval time, the smoother the curve appears.
Curve Timeout in Minutes (0 - 1440): Two consecutive values are only connected if the time interval between the values is smaller than this timeout.
This makes it easier to detect problems such as missing sensor values.
So set the value higher than the distance between two values to be expected in normal cases.
If the timeout is set too low (e.g. 30 minutes if a sensor sends every hour), the graph will only consist of single values that are never connected.
LONG TERM RECORDING
Use long-term recording: To use long-term recording, the field must be activated.
This is only available if the value/chart element is active as a chart element (see figure opposite "View as a chart").
If the recording is deactivated, all previously recorded data of this value will be deleted. Please use the CSV export in the visualisation to save already recorded data.
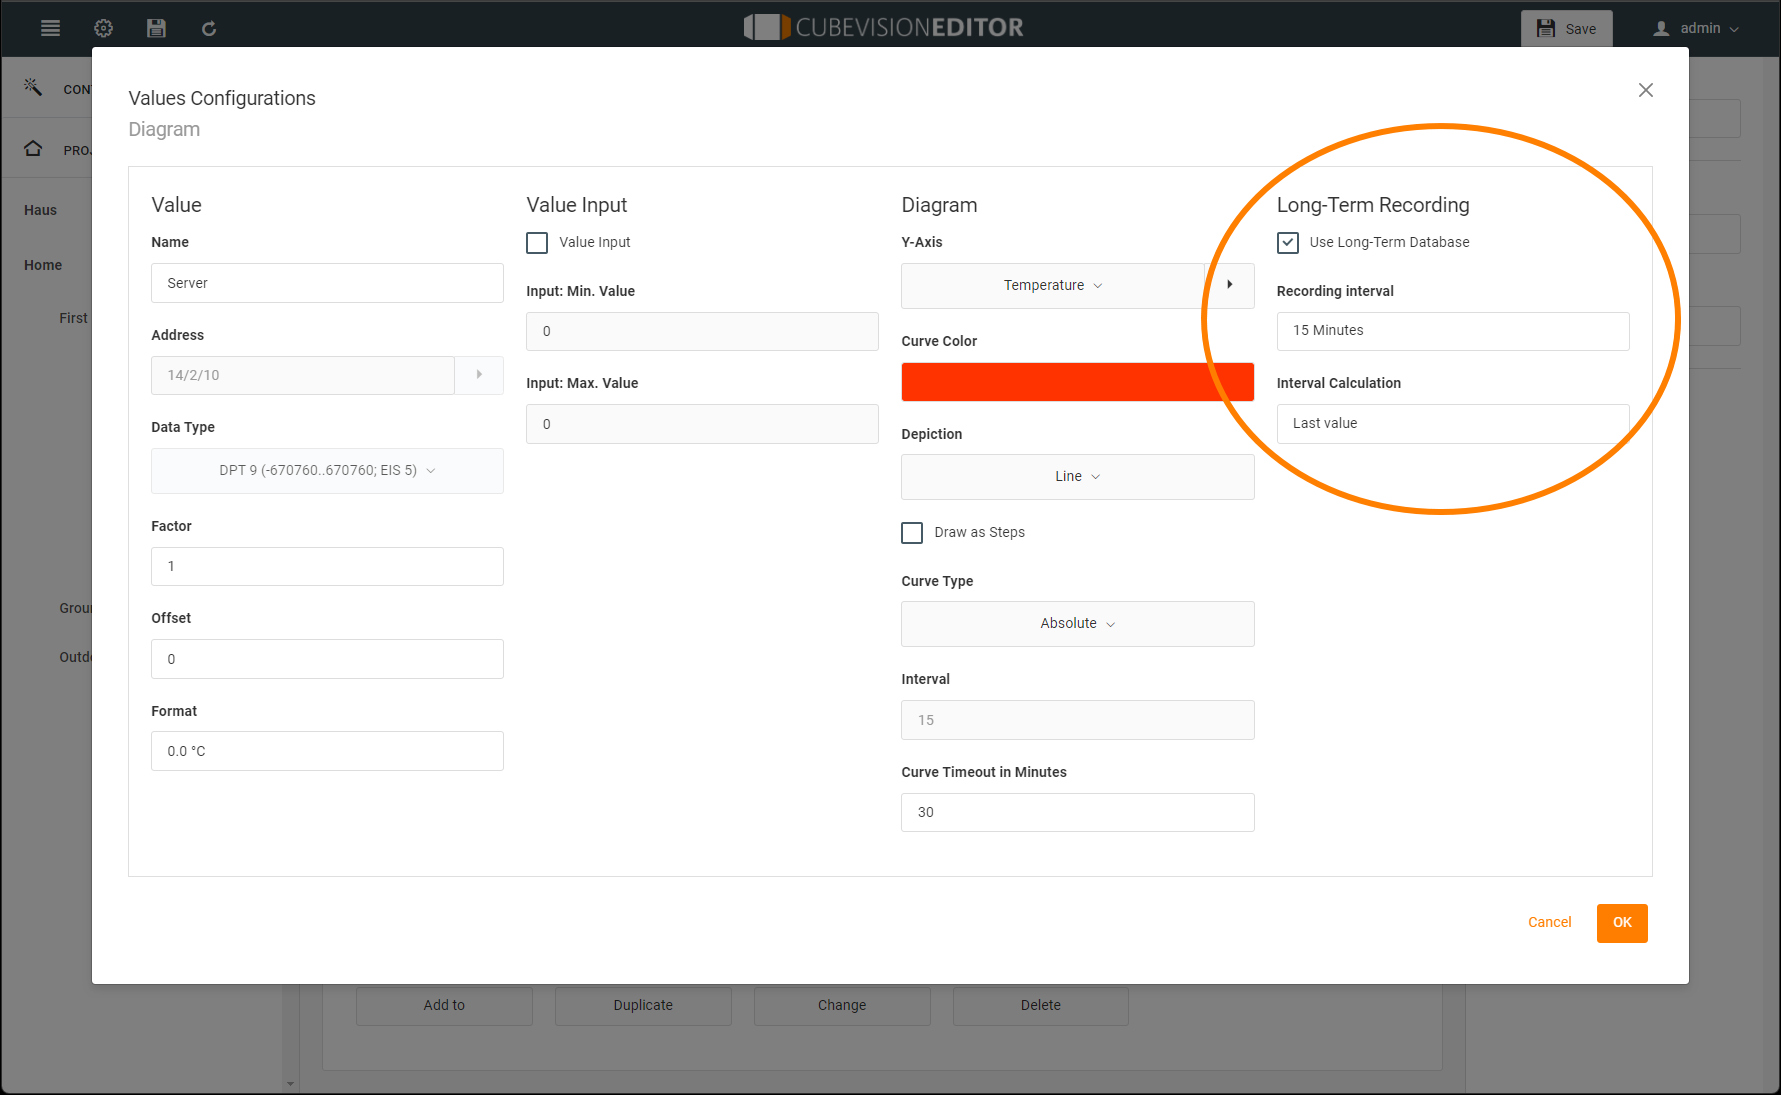
Recording Interval: Recording can be done either according to fixed interval or exactly with each received value.
Interval Calculation: Determination of the interval according to the selected type. This sets the type in which the group address is recorded.
-
Last value. The last value is recorded at the set time.
-
Maximum value. Only the maximum value is recorded.
-
Minimum value. Only the minimum value is recorded.
-
Average. The average value is recorded.
-
Interpolated value. The interpolated value is recorded.
-
Number of telegrams. The number of telegrams is recorded.
The long-term recording always saves only the data in the selected interval calculation. If the type of interval calculation is changed, all previously recorded data of this value will be deleted. Please use the CSV export in the visualisation to save already recorded data. Alternatively, you can start another recording for the same value with different settings.
In the case of long-term recording for minimum value and maximum value, for the interval calculation, if a factor < 0 is used under "Value", note that the maximum value is set for the recording of the minimum value and the minimum value is set for the recording of the maximum value.
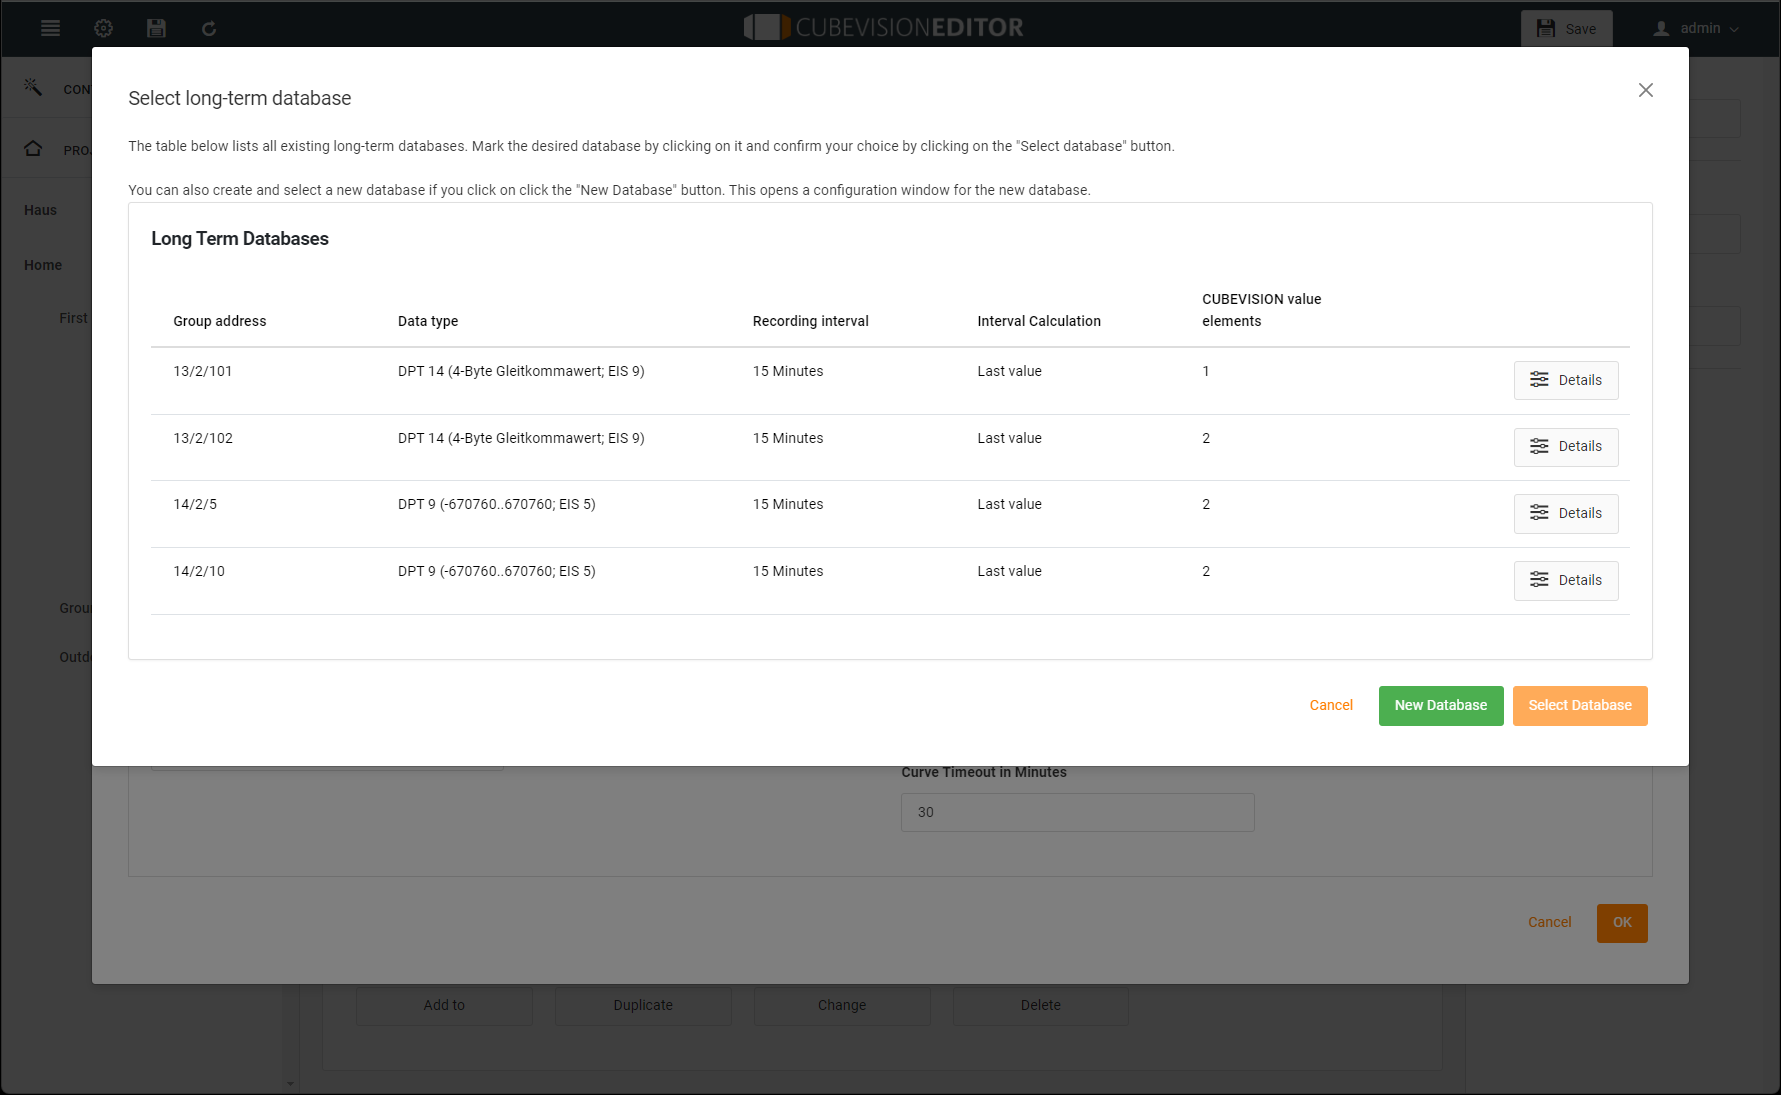
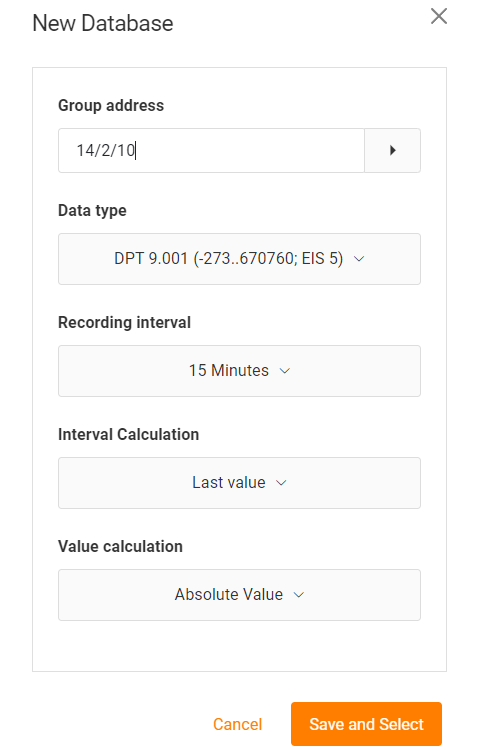
Create new database:
The following fields are to be configured:
-
Group address
-
Data type
-
Recording interval (live, 10 min.,.. 24 hours)
-
Interval calculation (average, number of telegrams, interpolated value, last value, maximum or minimum value)
-
Value calculation (absolute value, difference value)
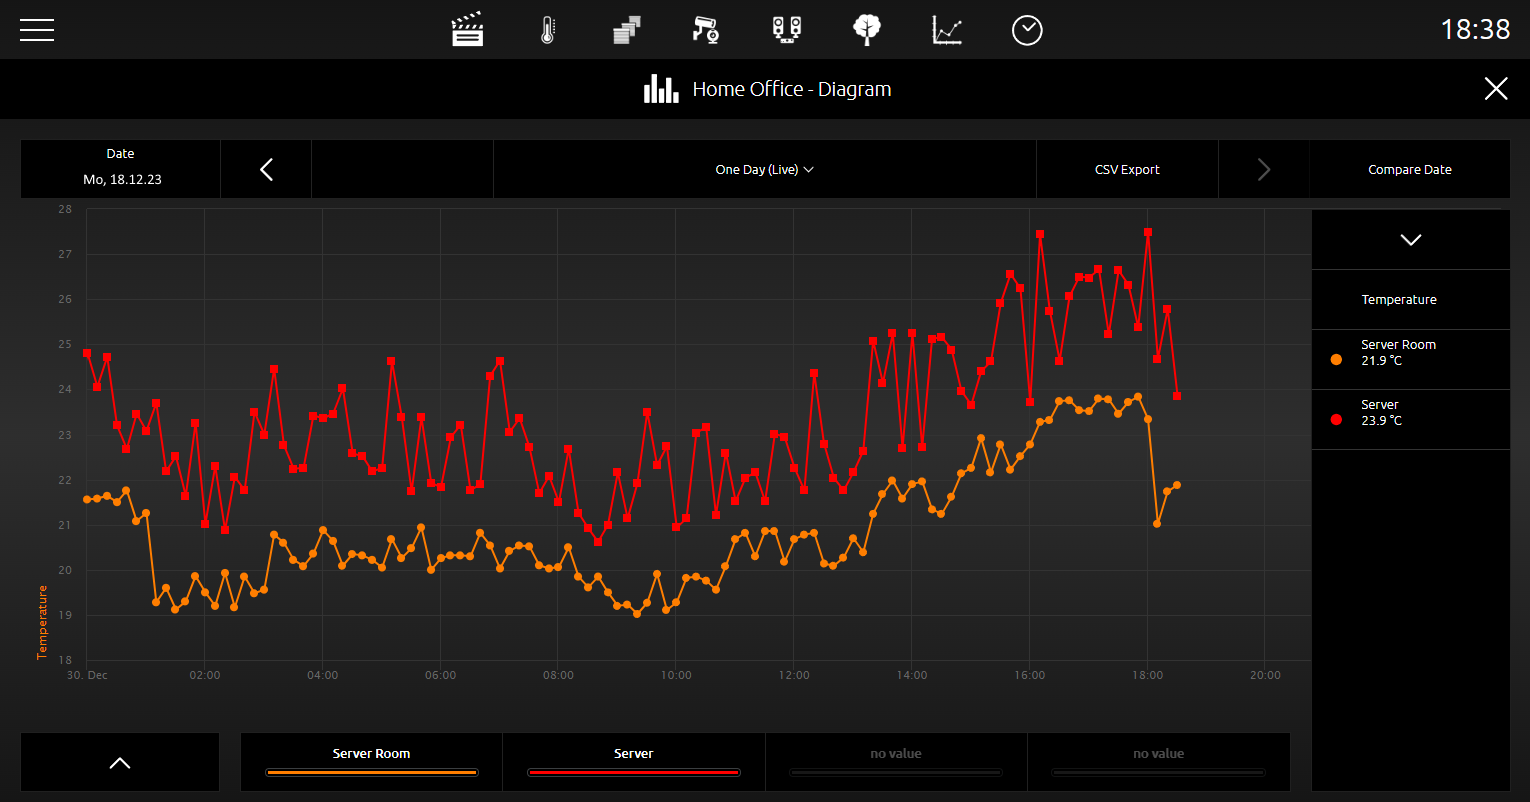
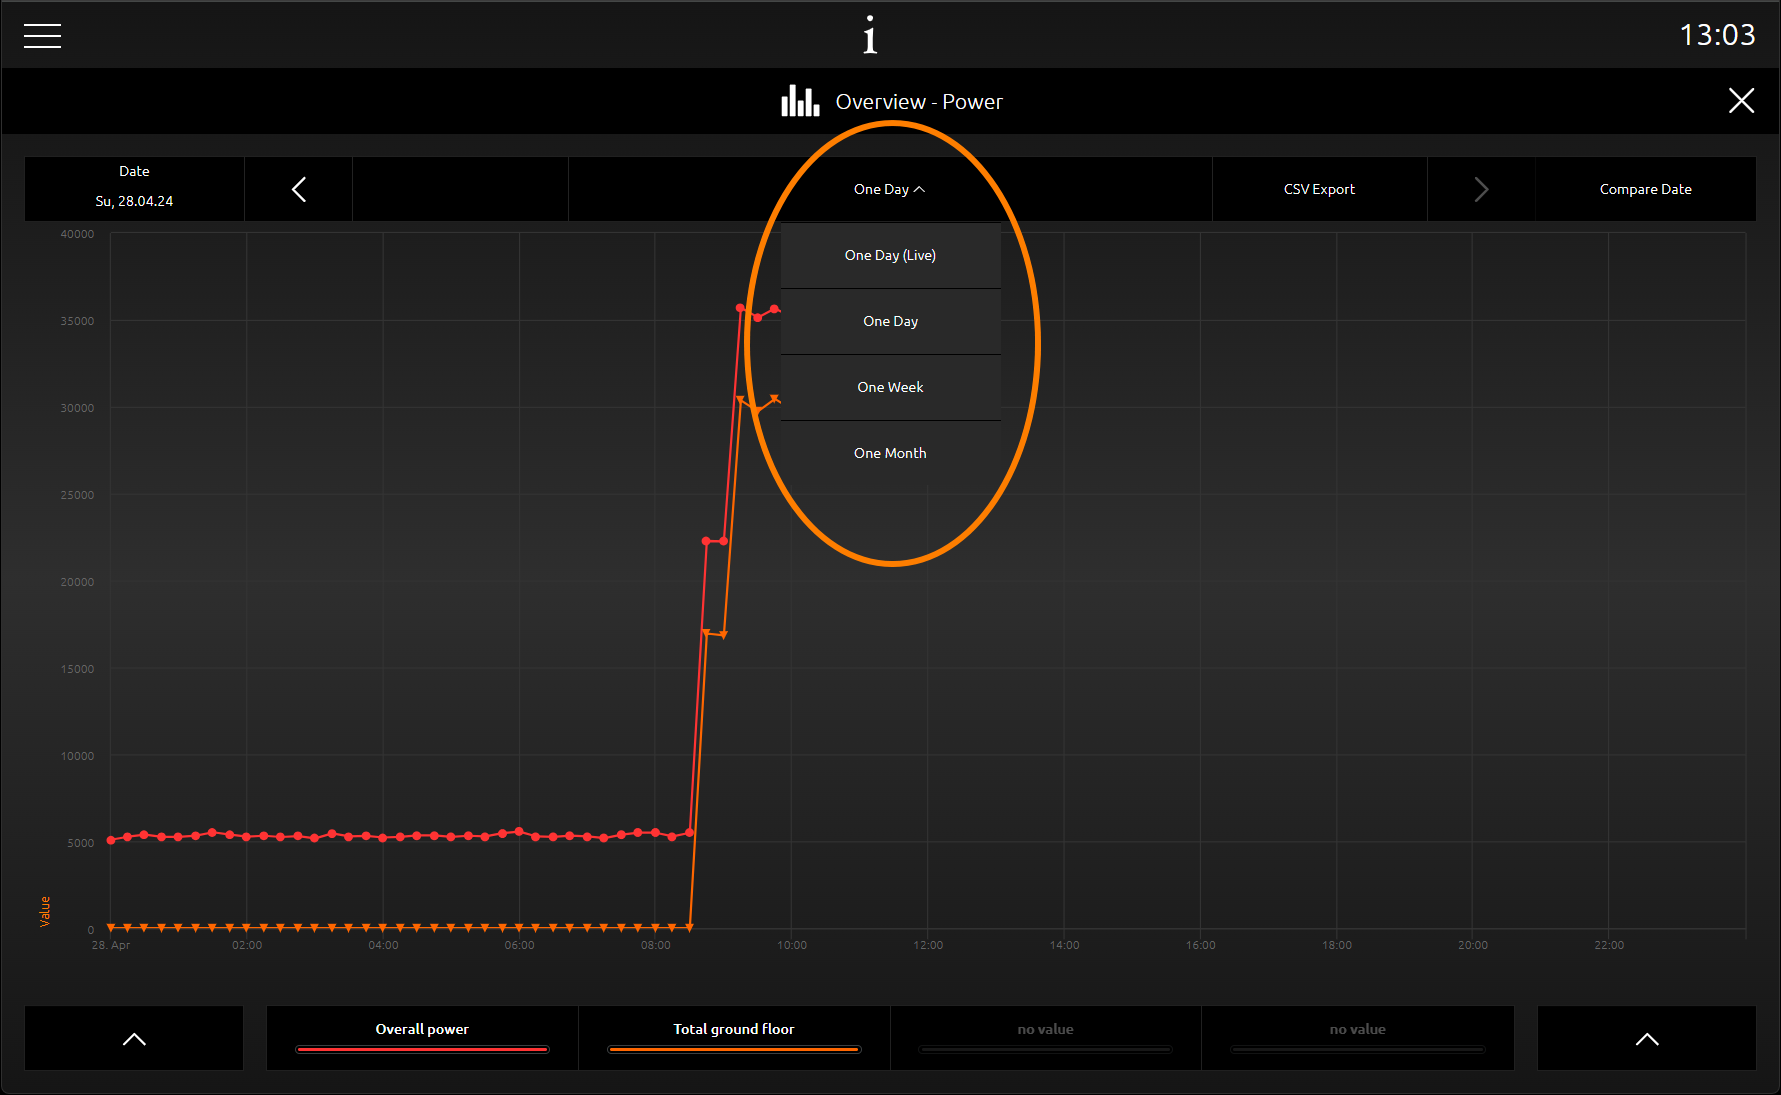
In the visualisation, the view of the long-term recording can be selected between recording for 1 day, recording for 1 week or recording for 1 month.
In addition to the selection of the desired time period, there is the date comparison to superimpose and compare time periods for analysis.
CSV export is only displayed if long-term recording has also been activated. Click on the symbol to download the values.
Values /Charts in the Phone view
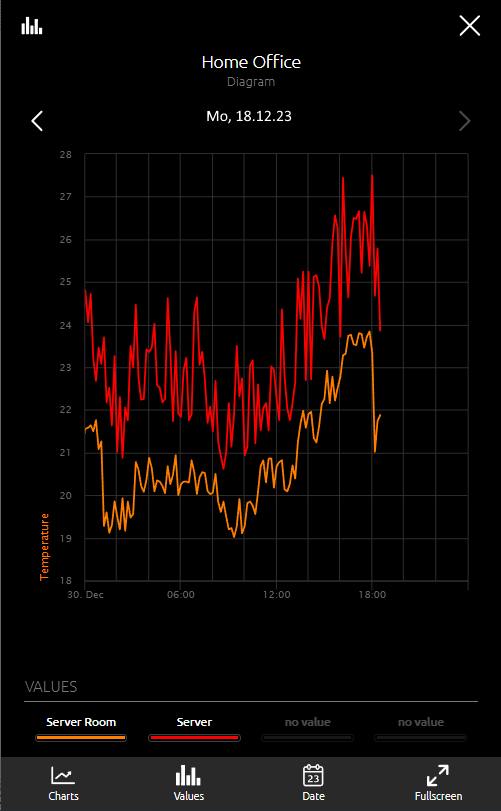
The visualisation in the phone view differs in some points from the visualisation in the tablet view.
Click on the respective icons to change the view of the graph:
-
Selection of the value graphs
-
Sliding the time periods
-
Zooming within the graphs
Furthermore, there is a menu line for further settings:
-
Diagrams
-
Values
-
Date
-
Fullscreen; the diagram is displayed on the entire screen without a menu bar. In this mode you can also slide the time periods and use the zoom function.
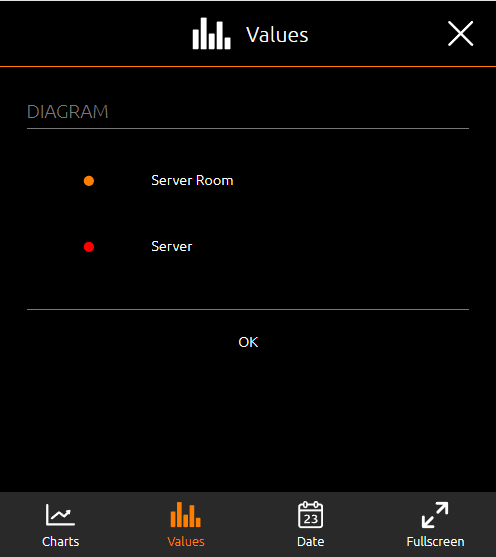
In the EEV phone display, the values to be displayed are activated via the menu item Values.
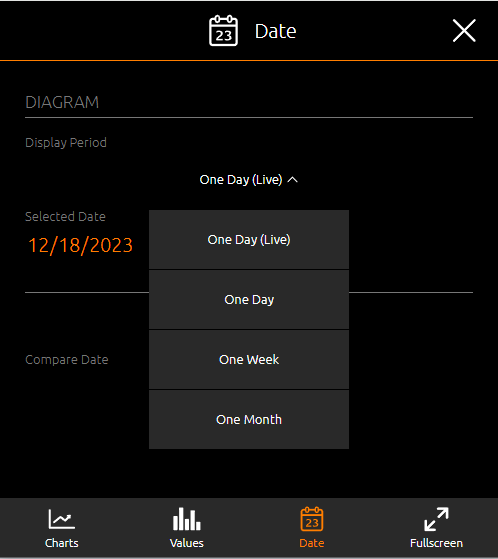
In the figure on the right, under the menu item Date, the periods to be displayed are set and comparison periods can be selected. In this way, value analyses can be carried out very quickly.