With the transformator, you can depict input values for a specific value range on another value range. A frequent case of use is the transformation between two value ranges. One straightforward example is the conversion of DPT 5.001 (0-100%) into DPT 5.010 (0-255). A straightforward linear transformation can be carried out without an appropriate graphic interface, but it can also be easily achieved with the Mathematics. The transformator is therefore to be used with not absolutely linear transformations. By way of example, a rudimentary constant light regulation on the basis of the data of a LUX sensor.
Contents
Inputs and outputs
Inputs
-
GATE (see Logic Elements | Datapoint Gate)
-
IN
The input value for evaluation. The only values to be processed are those which can be interpreted as a floating point number.
Outputs
-
OUT 1 ...
Up to five outputs, each of which are represented by an individual transformation graph.
Configuration
The number of outputs is created directly in the parameter window. The gears icon in the initial configuration provides access to the advanced configuration. You then enter a diagram view, with which you are able to define the output values on a required input value range in the form of curves.
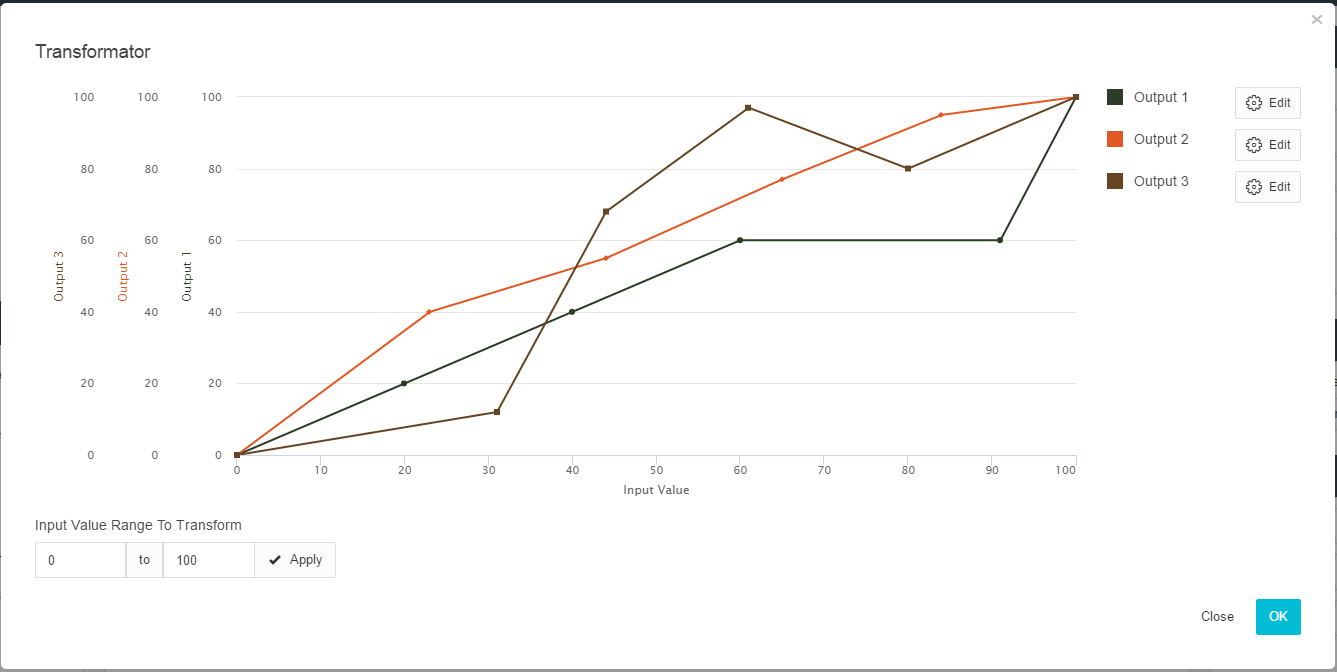
The input value range (x-axis) is defined via the input field situated below. An individual output value range (y-axis) can be created for every output, and therefore an individual graph.
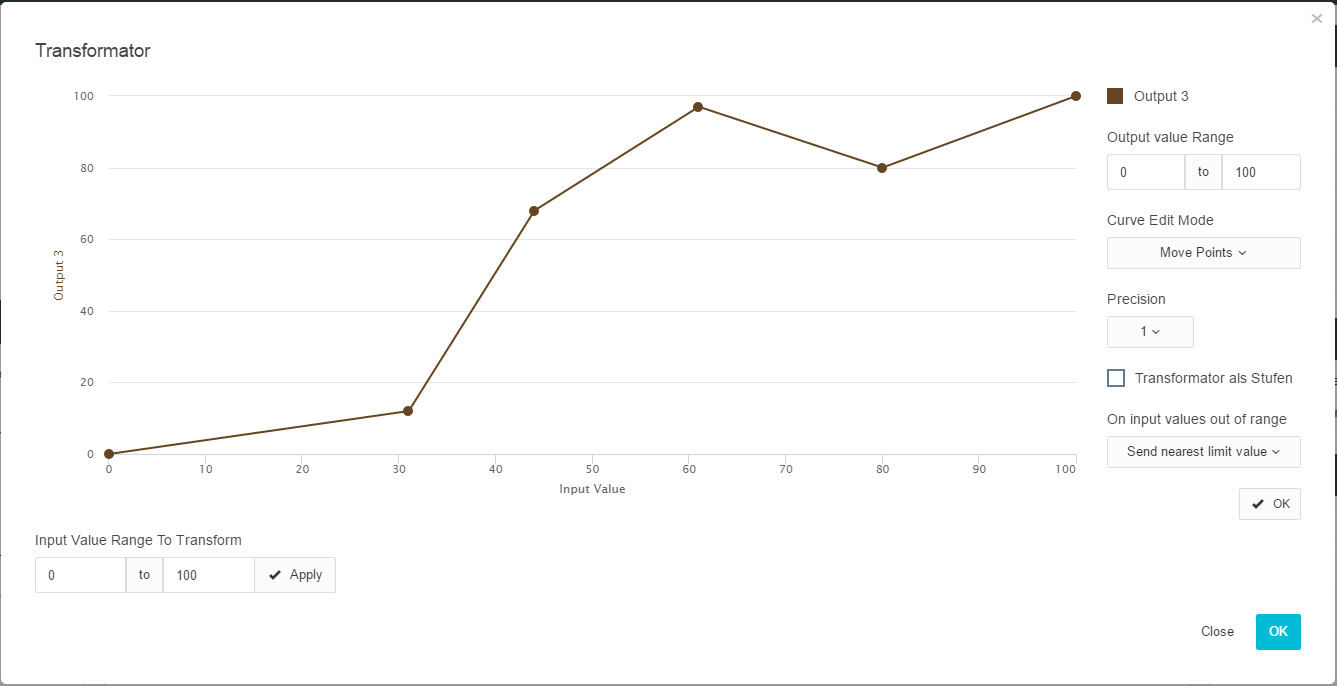
Output value range
Enter a random value range.
Please remove or move the previously set points to the required area if you want to decrease them in size. This is not possible a later stage.
Curve editing mode
Two modes are distinguished between.
Moving points
Move the existing points on the area at random
Adding/deleting points
To delete a point, go to the line near the point which is to be removed using the mouse and wait until it is highlighted as selected. Now remove the point with a mouse click.
To add a point, please click on the buttons and make sure that no point has a selection and then click. At this point a new point is created and the graph is redrawn accordingly.
Precision
If you release or move points, it is almost impossible to achieve an exact coordinate. By way of help, you can position the points on the grid precisely, on the whole number, 0.5 or 0.25.
Transformator as steps
The graph can be interpreted in steps, like “Output 2” in the example. In this case, the value of one point until the next successive point applies.
With input values that exceed the limits
If a value arrives which is not covered by the defined value range, three possible responses are available to select:
-
Do not send
No output value will be generated -
Send next limit value
-
Send input value
The input value will be guided to the accompanying output in unfiltered form.
OK
You can access the outputs selection again via the buttons.
///